


Hey all, you may have stumbled across this thing I built earlier this year, but I’ve been continuously updating it with new datasets and better analysis. I’ve moved it to publiclandsdata.com with a fresh coat of paint. Whether you work in the industry, local gov, tourism, or are just curious, it might have some answers for ya!
~Kyle
How many people visited public lands last year?
For a long time, that wasn’t a particularly easy answer to get. Not because it was impossible, per se, but because the National Park Service, the Forest Service, the Army Corps of Engineers, etc, all counted their visitors in different ways, at different times, using different definitions, and then published that data in different formats in different places on different timetables. (The answer, for 2024, was 947 million visits)
I’ve written a lot of data dives for Here & There, ranging across different slices of public lands and recreation data. I mostly followed a similar, tedious process every time: find the PDF summary of the report → find a CSV file with more complete data → import that to Excel → clean it → do an annoying amount of table wizardry to answer specific questions → manually create a few charts to accompany any analysis.
Over the last year I’ve been working on building and improving publiclandsdata.com, originally as a resource for myself and eventually as a more public-facing way for anyone to access a wide range of data about public lands.
What’s in there?
NPS visitation - across 405 units, not just the 63 National Parks. Monuments, historic sites, battlefields, seashores, parkways and more.
Recreation.gov bookings - 79 million transactions from 2007 to 2025
FICOR unified visitation data - 947 million visits for 2024 across 2,065 units and six agencies
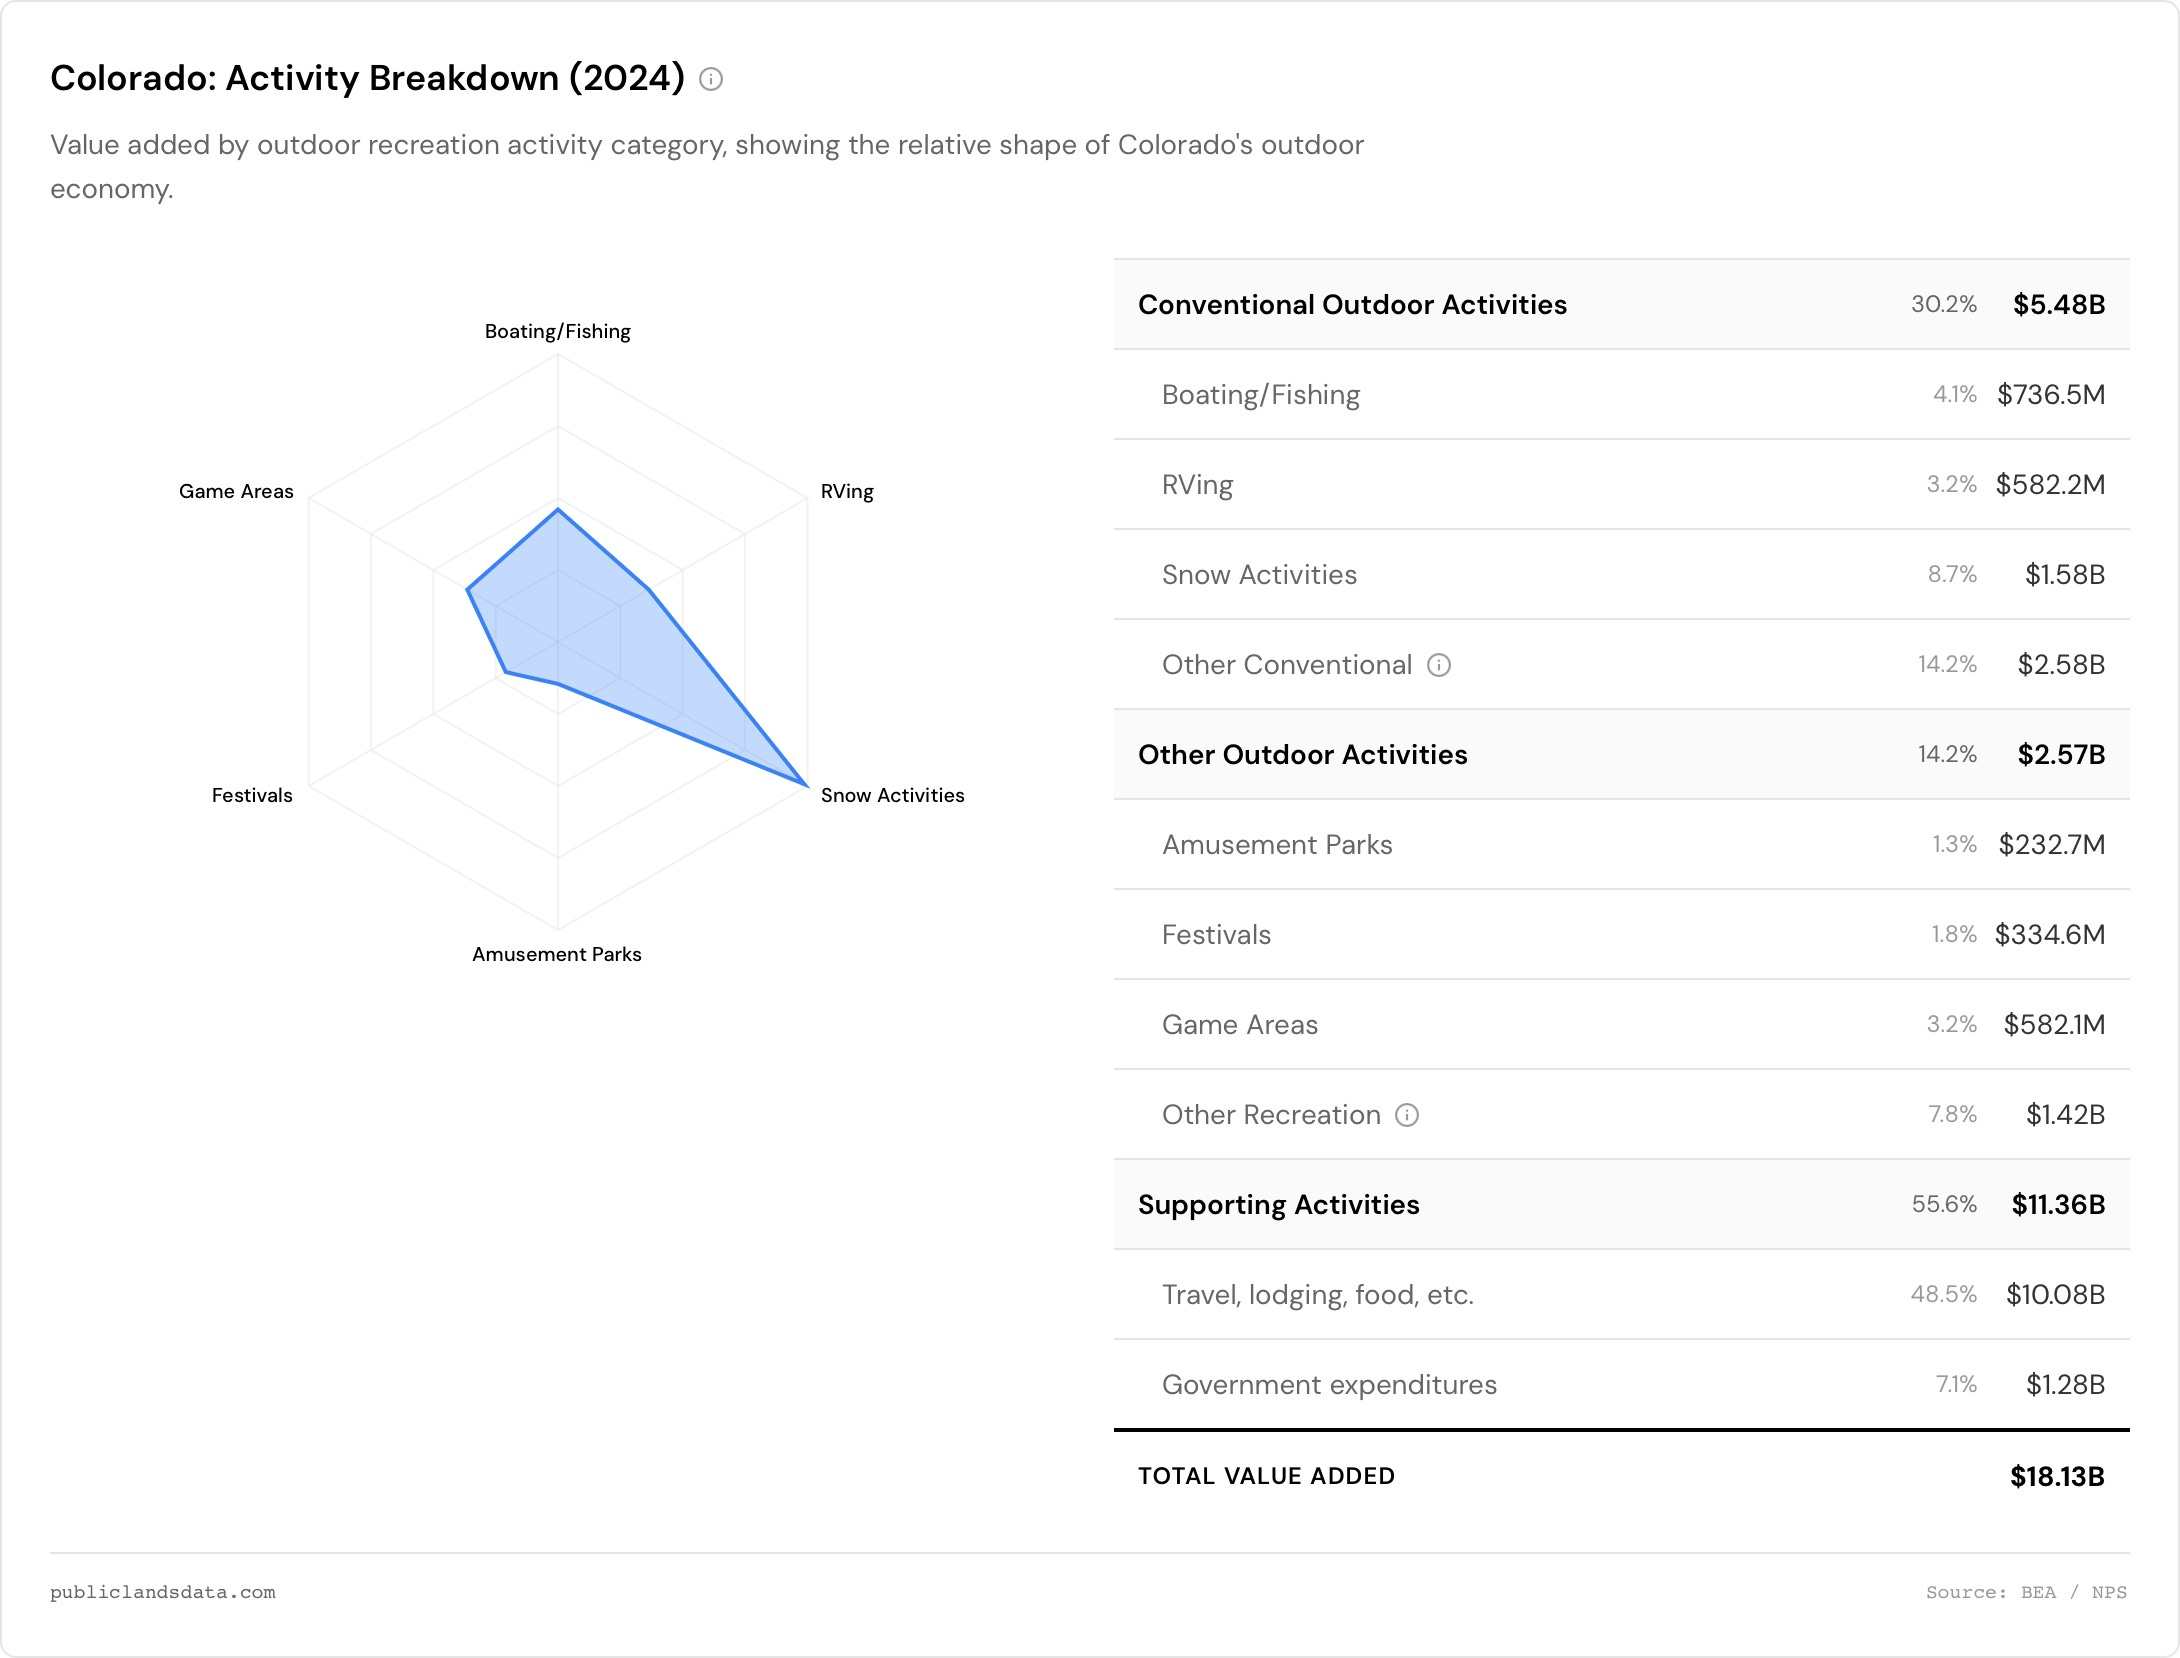
Outdoor recreation economy - BEA data tables by activity, industry, and state
Also GAOA projects, and federal recreation inventory
This data is all public. But the gap between "public" and "usable" might as well be the Grand Canyon in most of these cases.
The work
Most of my time went into the architecture, not the visualizations: pulling down everything available, working out what each agency actually meant by its columns, and then normalizing across years and formats.
A few examples: Recreation.gov transaction data comes in 3 different table formats across the available years. NPS reports by calendar year; Rec.gov and the interagency report use the federal fiscal year, so the same park can have two visitation numbers for "2024" and both are technically right. Rec.gov identifies a park by a four-letter code (NOCA), GAOA identifies it by unit name, and BEA doesn't know parks exist at all, only states.
All those issues had to be addressed before I even started to think about what makes this data interesting, what people would like to learn from it, and how to visualize that.
Nobody is looking for a dataset
If you really dig into “what are people looking for,” it’s usually information about a place. Nobody wants a "reservations dataset," they want to know how many people visited Yosemite last year.
So, under the hood it’s organized around datasets, but with extra effort around parks and states, because if you dig into what people are actually looking for, it’s usually information about a place.
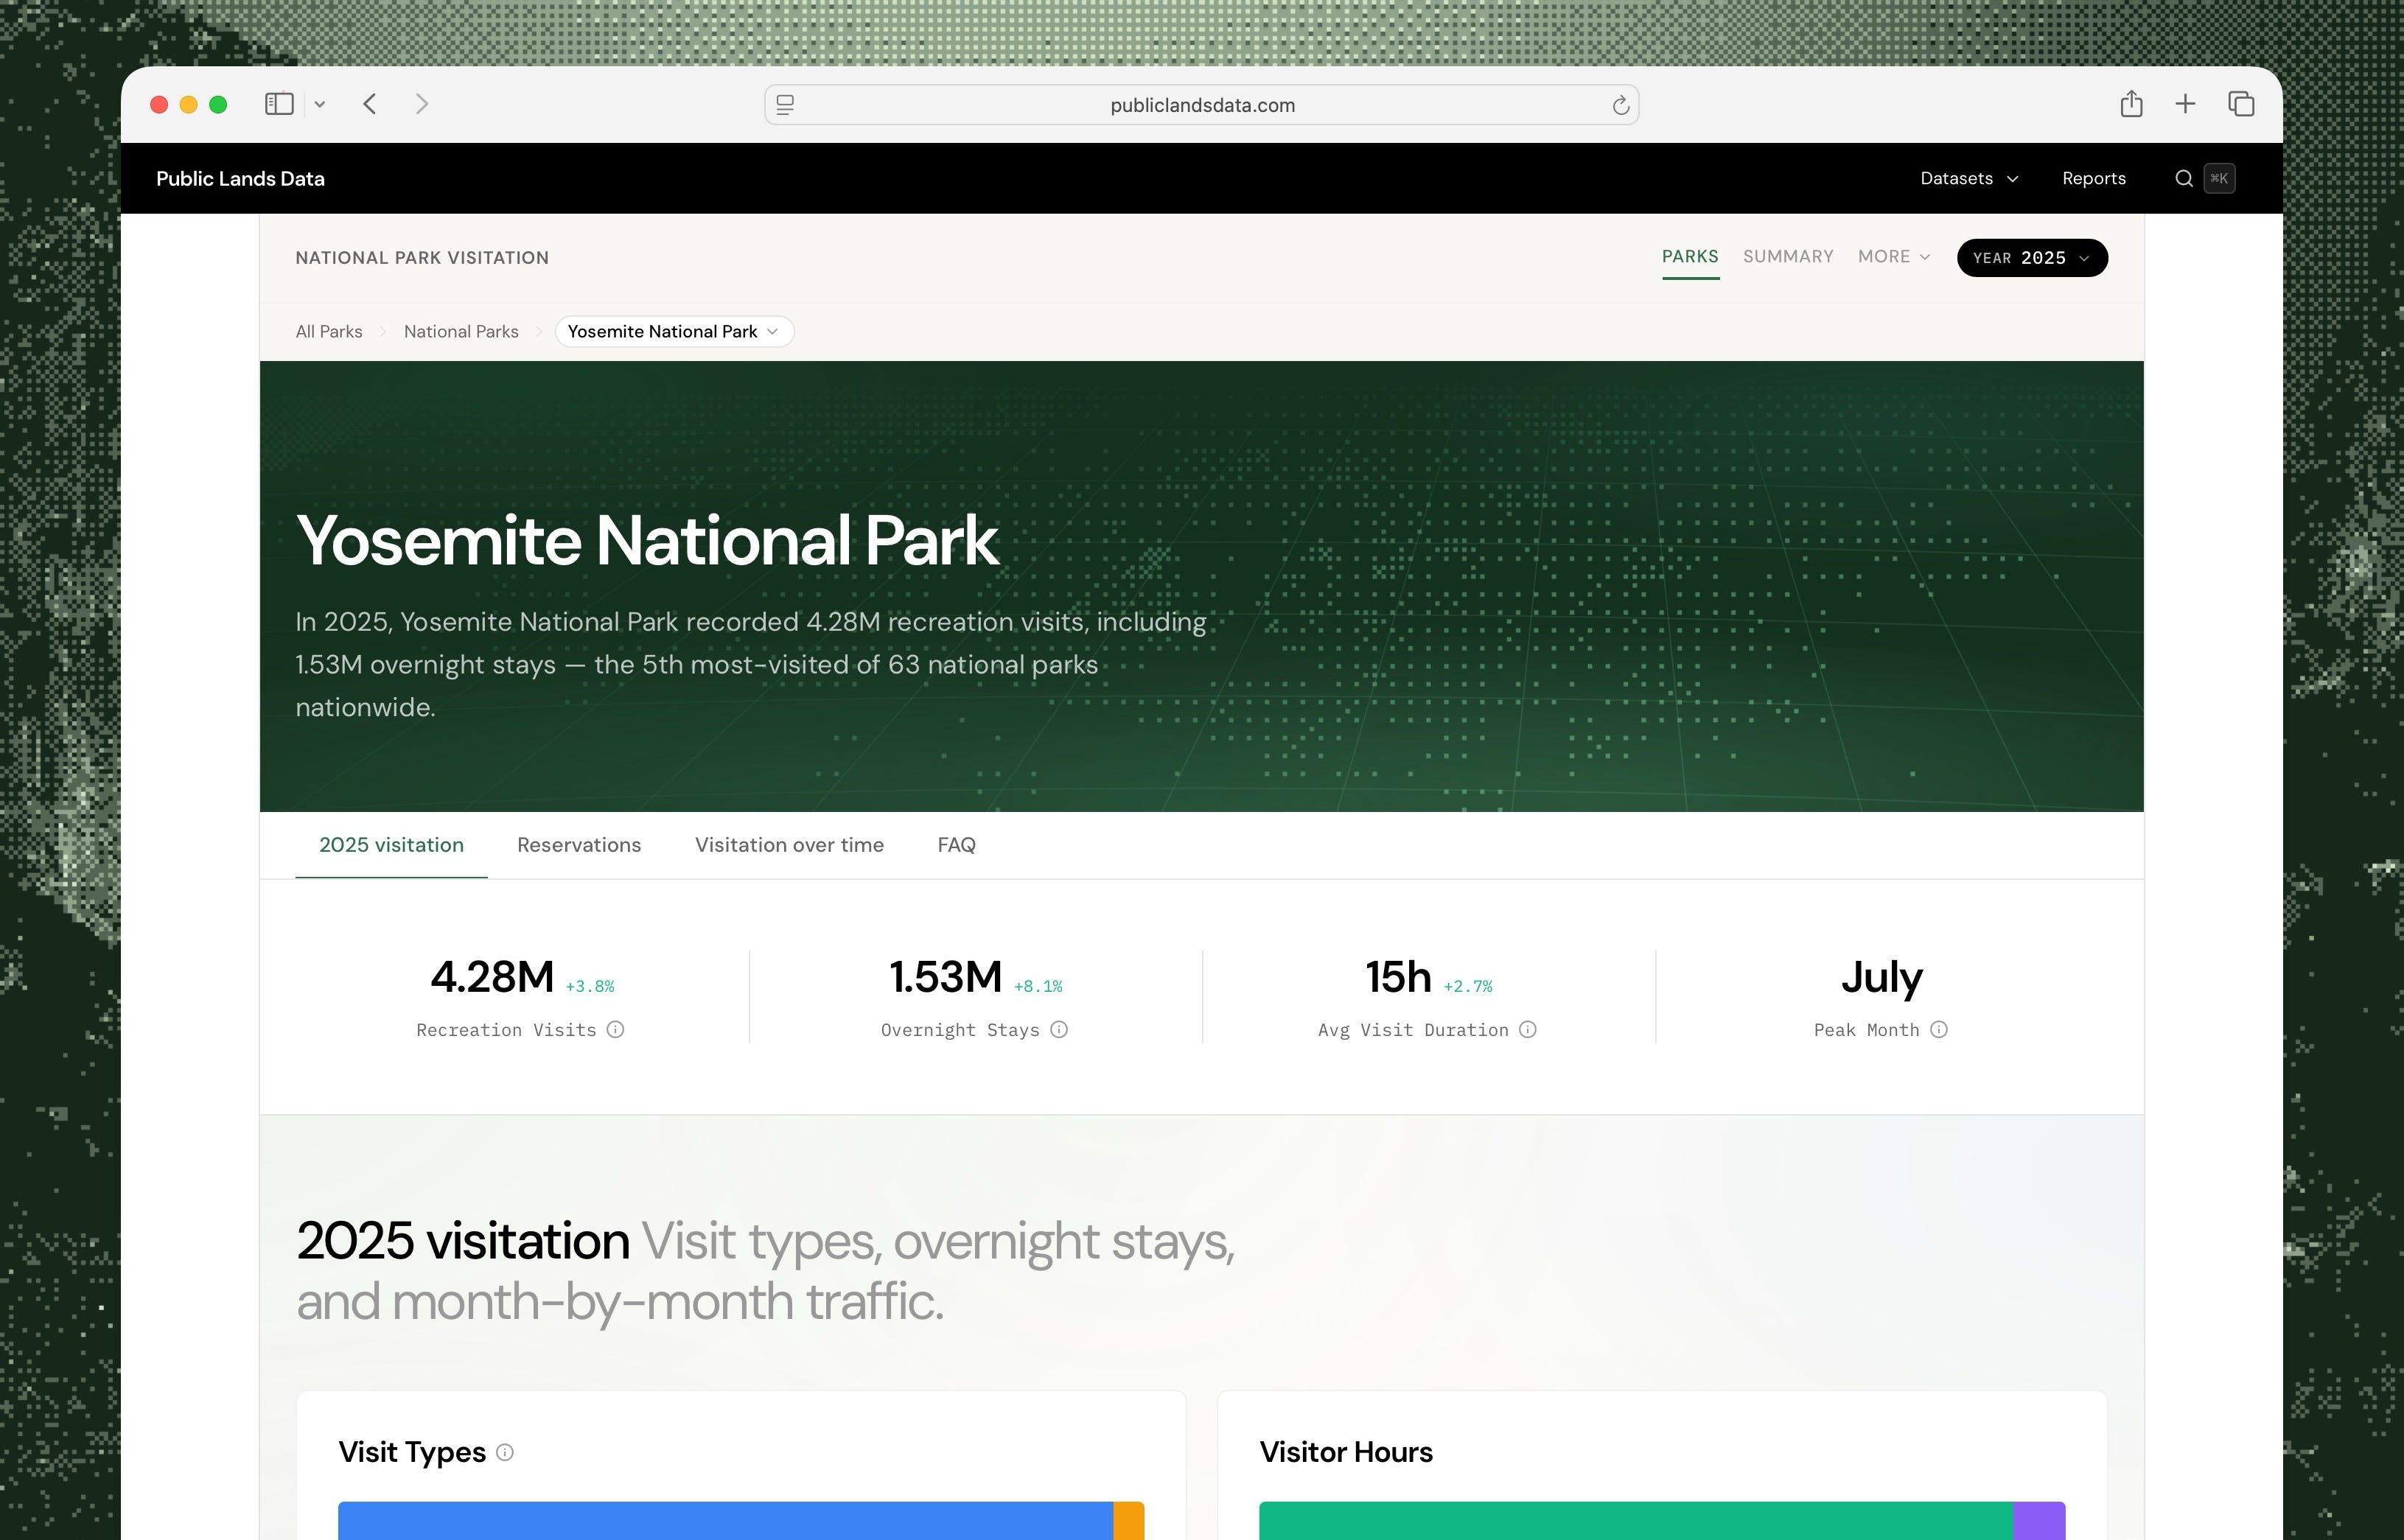
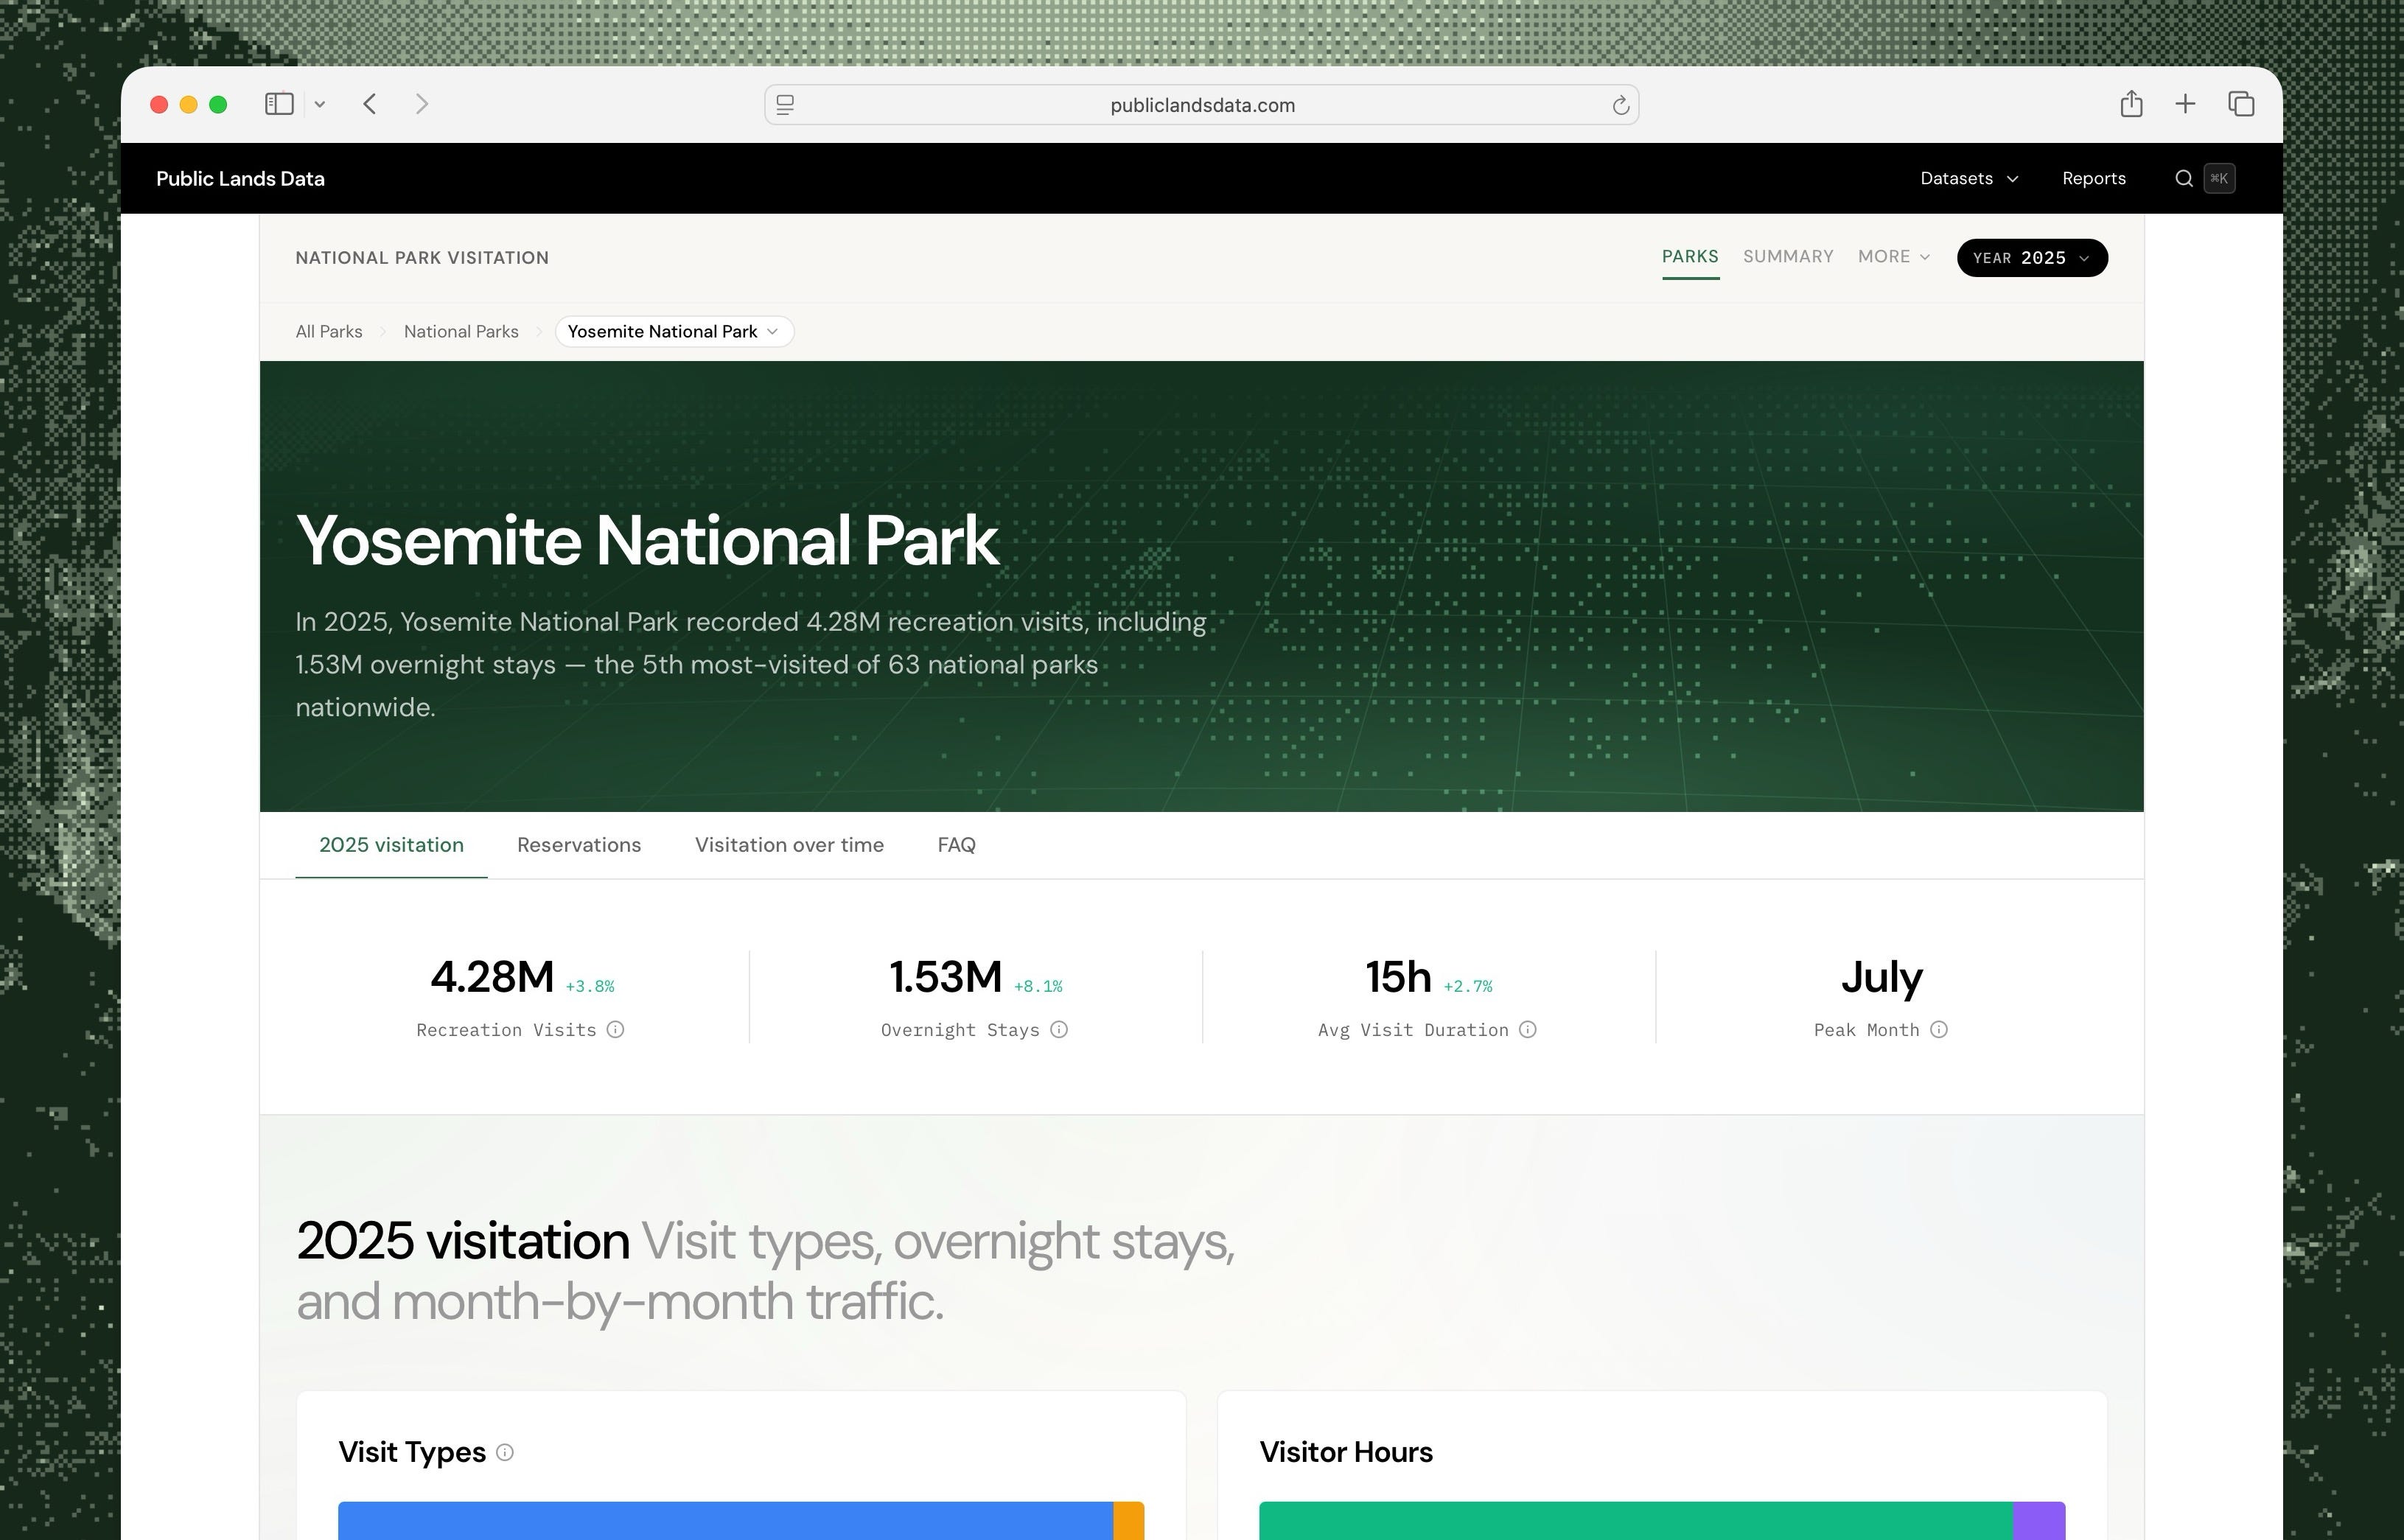
Every NPS unit (not just National Parks) has a page with its visitation history, overnight stays by type, and seasonality, most going back to 1979. I also pulled in the Rec.gov bookings for each park, so you can see visitation and reservations side by side, and links out to activity breakdowns and the state outdoor economy numbers.
In a few key places I added annotations to provide additional context. That YOY spike in North Cascades visitation? It’s really more about Highway 20 re-opening after the 2024 fires than it is a surge in interest. There are similar annotations for Yellowstone’s 2022 flooding, the Ferguson Fire closing Yosemite, and more.
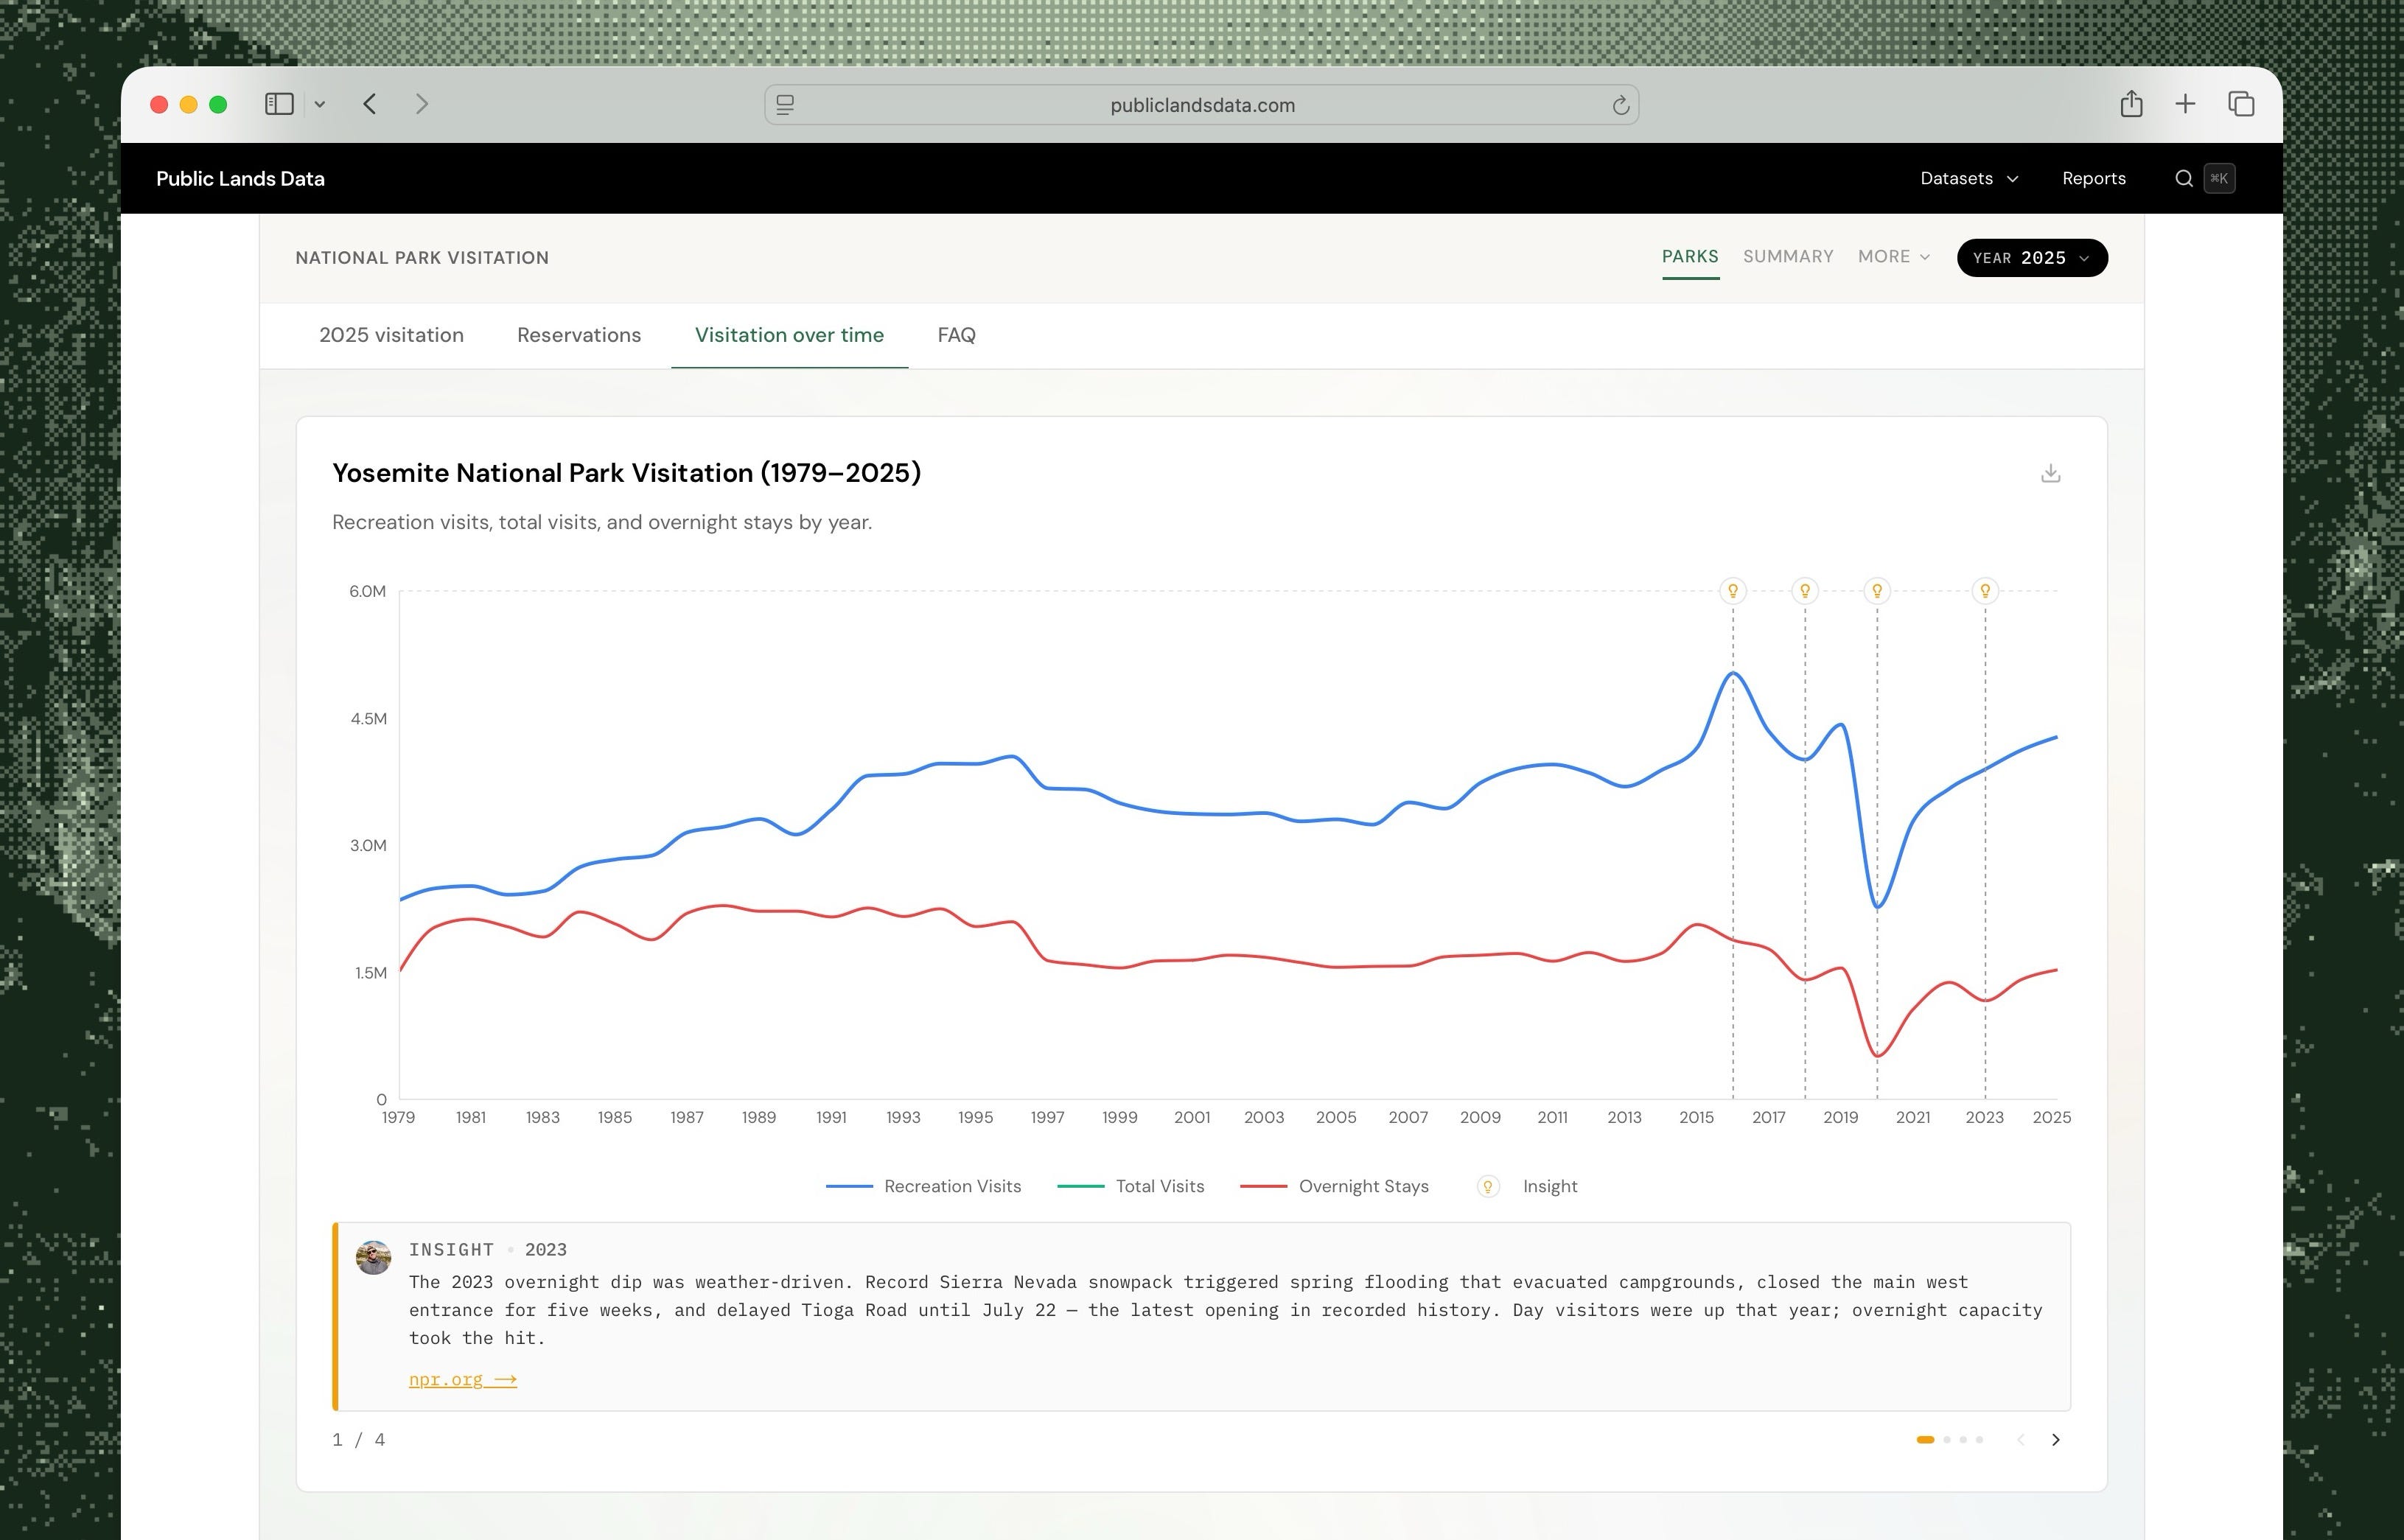
The annotations piece isn’t particularly scalable across all units but I’ll continue adding them as I look into different things.
Who’s it for?
I mean, I mostly built this for me, but journalists, gateway towns, tourism boards, and local government might all find this useful. Anyone who has a specific question about recreation visitation/economy and doesn’t want to spend forever comparing different data sources.
Some questions you might be able to answer:
How many people visited Canyonlands in 2025? (796.1k, -2.7%)
What industry contributes the most to the outdoor economy in Indiana? (RVing, over 30%)
How many timed entry reservations did Rocky Mountain National Park sell in 2025? (579.6k)
What’s the most visited National Monument? (Castle Clinton, it’s the ferry ticket office for the Statue of Liberty)
There are still gaps. Some agencies report better than others, some years are missing, and the annotations only exist where I've spent additional time digging into things. If you spot something wrong or confusing, let me know. The site will get better the more people poke at it.
And if what you’re interested in goes beyond what's easily available on the site, feel free to reach out. I can probably put together a custom report at the state or regional level with a more detailed look at things.
Anyways, poke around, enjoy, and hopefully a few of you will find it useful or interesting.