




I’ve done these dives for a few years now, but this is the first time I’ve had publiclandsdata.com fully set up for a data release, which means everything is already updated and broken down by activity/industry/state/etc on the site if you want to get a more granular look at things.
Outdoor recreation economy: By State | By Activity | By Industry
~Kyle
The Bureau of Economic Analysis (BEA) released their latest report on the Outdoor Recreation Economy this week. If this feels like déjà vu, that’s because we did just this in March. That report was late, so we’re now closer to a “normal” release of 2025 data.
The headline numbers for the outdoor recreation economy in 2025: $1.3 trillion in gross output, $704.2 billion in value added (2.3% of GDP), and 5.3 million jobs.
Yes...that’s the same $1.3 trillion headline as last year 🫠. Part of that is rounding (we technically went from $1.253T to $1.297T), and overall, we’re looking at several trends from 2024 that seem to be continuing.
(One housekeeping note: the BEA revised a lot of last year’s numbers down in this release, so some of the 2024 figures here won’t match what I wrote in March.)
The BEA’s definition of outdoor recreation pretty broad. Yes, there’s hiking, and camping, and biking. But also gardening. Kite flying. Oil and gas extraction. Golf. Flights. Amusement parks. Boat manufacturing. Car rentals. So when you hear a “$1.3 trillion outdoor economy,” what is being referenced is an collection of connected economic activity that was all somehow related to outdoor recreation.
Gross output vs. value added: Gross output is total sales, and value added subtracts what businesses paid their own suppliers (leaving you with what the industry itself contributes).
In dollars vs. after inflation: “In dollars” is the raw numbers as reported in the current year’s prices. “After inflation” takes the price increases out (the BEA uses 2017 dollars), so it only goes up when people actually buy or do more.
Core activities: This is what most people picture as “outdoor recreation”: boating, fishing, RVing, hunting, hiking, camping, skiing, biking. The BEA calls these conventional.
Other activities: Things done outside that the BEA also counts, such as golf, amusement parks, festivals, guided tours and gardening.
Supporting activities: Spending around outdoor recreation: travel, lodging, food and shopping, etc.
Growth in the outdoor recreation economy slowed, again
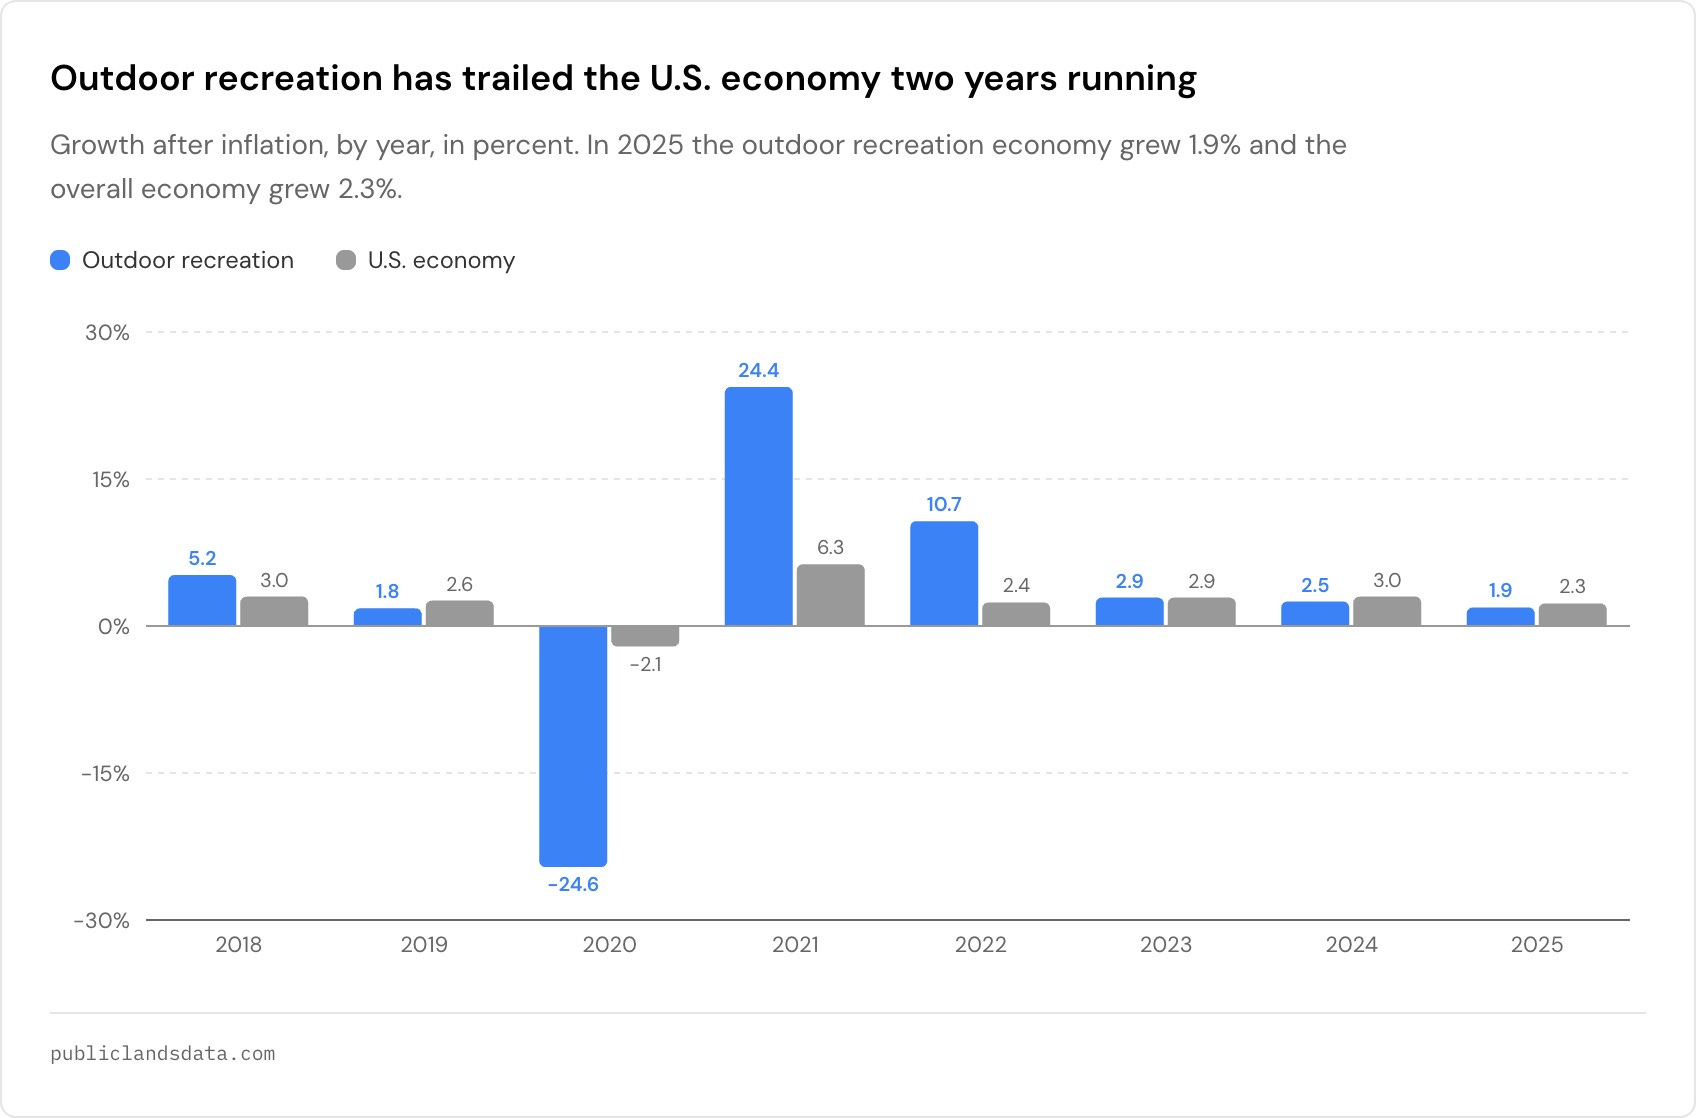
After inflation, the outdoor recreation economy grew just 1.9% in 2025 while the overall U.S. economy grew 2.3%. In March I suggested that the narrative of “outdoor recreation outpacing the economy” was over, and that seems to be playing out.
But it’s a little worse than that. After revisions to previous year’s reports, the outdoor recreation economy hasn’t outgrown the U.S. economy since 2022. It’s still growing, but at a pace that’s slowed down every year since the post-pandemic pop.
To be fair, 2025 was a weird year for the whole economy. A lot growth came from AI investment, and wealthy households kept spending while hiring slowed and lower earners got squeezed (a K-shaped economy).
The patterns in the outdoor recreation economy do end up looking a lot like the economy overall. Expensive things got more expensive, big-ticket purchases like RVs kept shrinking, and cheaper, more accessible things (hiking, camping, fishing) held up better.
Much of the growth is inflation
Overall value added grew 3.5% in 2025, but adjusted for inflation, it grew only 1.9%. That means around half of this year’s growth is inflation.
Ten of the main activity categories grew in dollars but shrank after adjusted for inflation. That includes things like skiing, snowboarding, golf and tennis, guided tours (on land and on water), sailing, bicycling, and horseback riding.
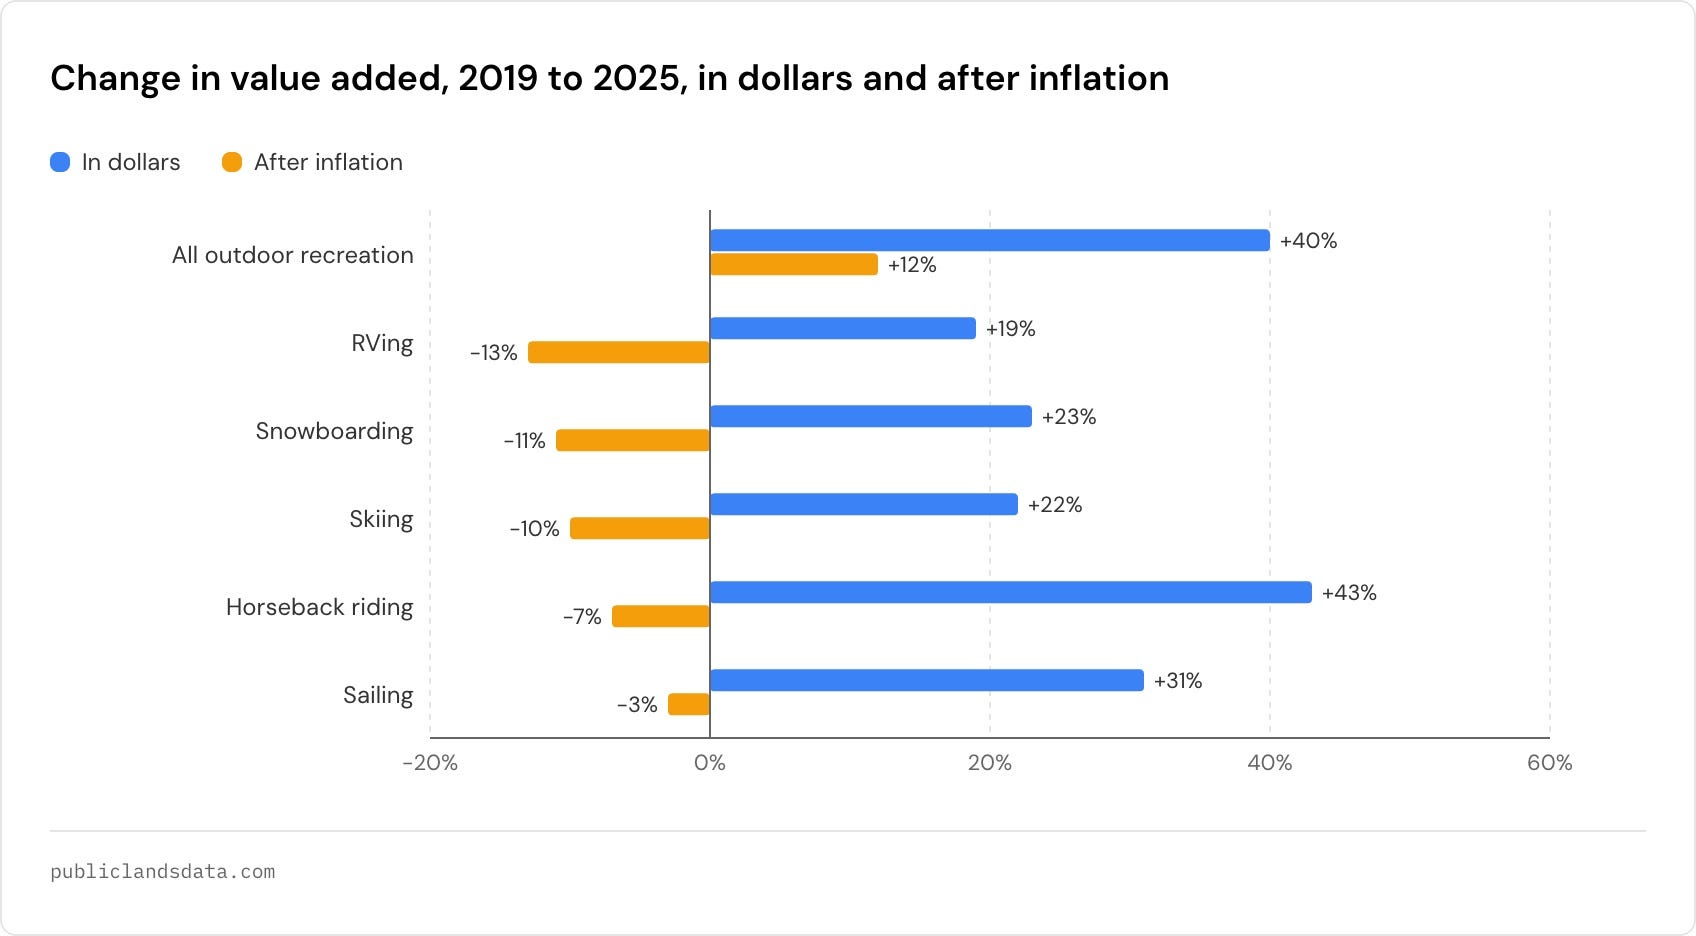
And since 2019, RVing (-13%), skiing (-10%), snowboarding (-11%), horseback riding (-7%), and sailing (-3%) are all smaller after inflation than they were before the pandemic, even though every one of them is bigger in dollars.
Skiing is one of the clearest examples of this shrinkage. The 2024/25 season was the second-busiest on record and skiing’s value added went up 2.2%, but adjusted for inflation it fell 4.7%. It’s now about 10% smaller after inflation than it was in 2019. Busier mountains, higher prices, but a smaller economic impact overall.
The activities
Let’s get into what changed among core outdoor activities.
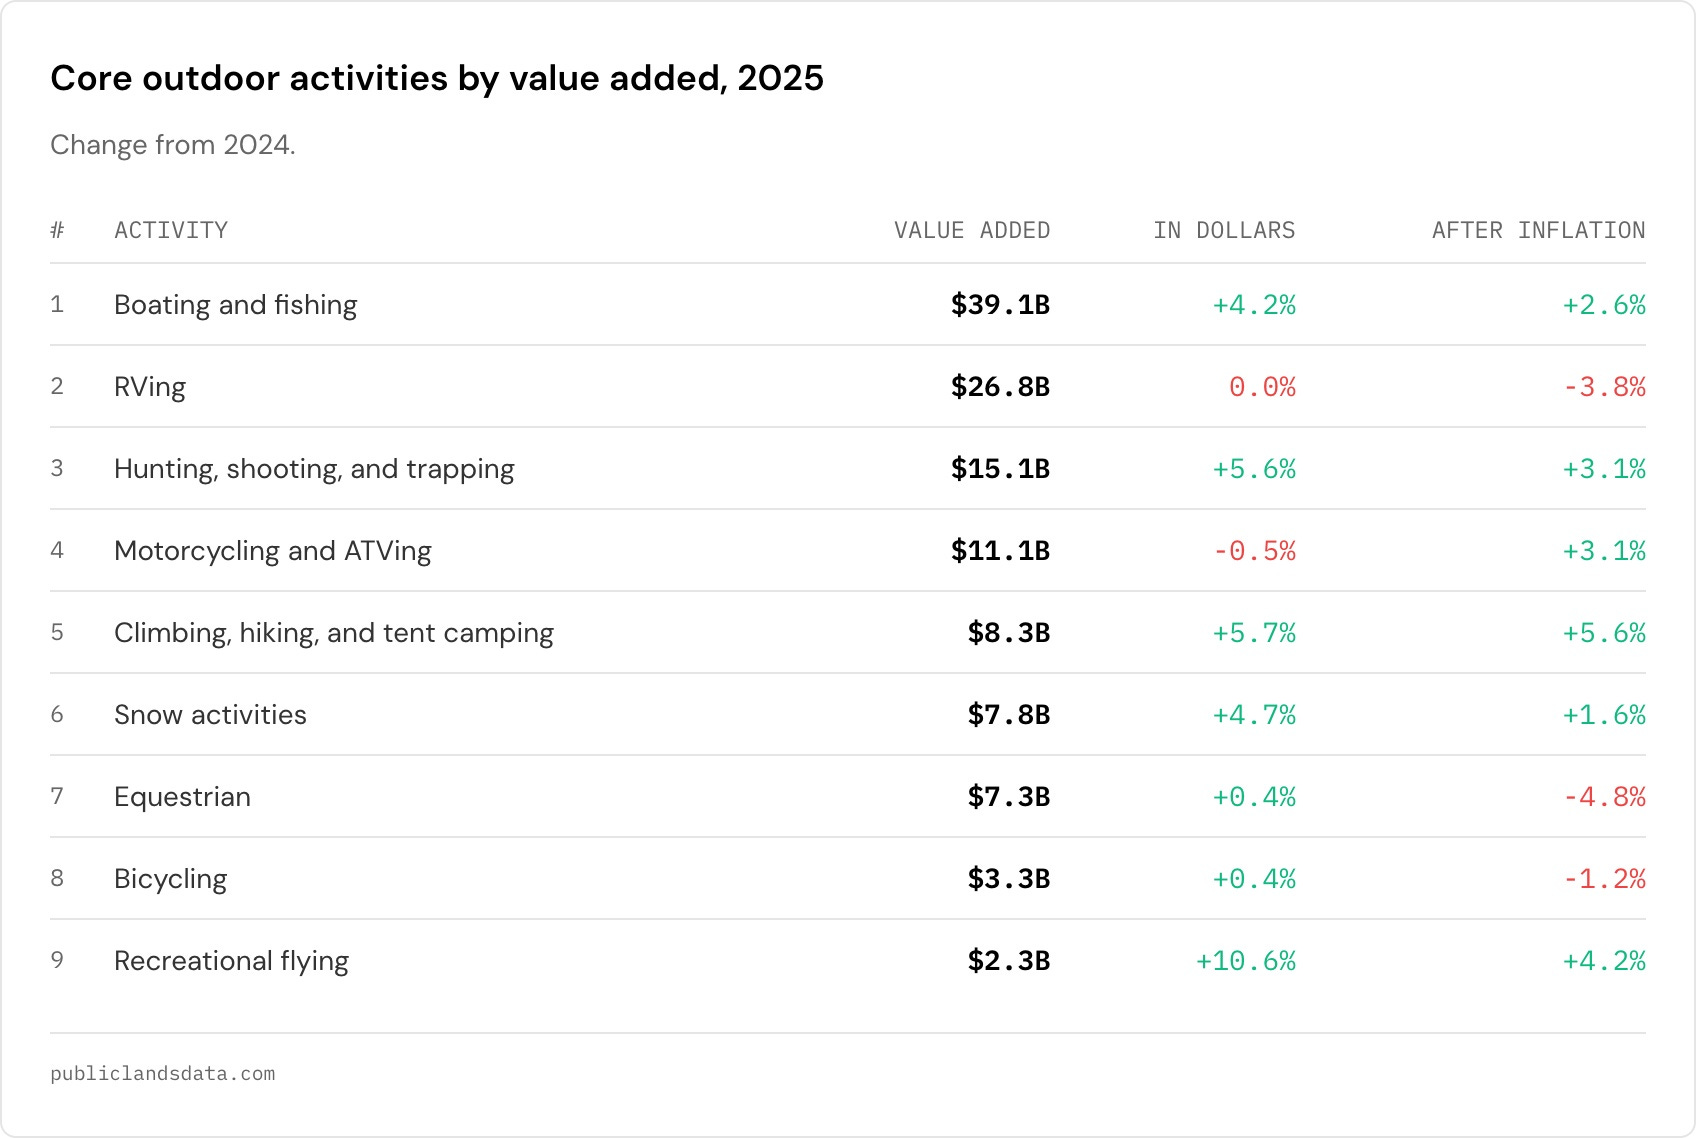
Boating and fishing is still the biggest conventional activity at $39.1 billion, up 4.2% after two relatively flat years.
RVing came in at $26.8 billion, flat in dollars and down 3.8% after inflation. Last year I called this a sustained downturn rather than a correction, and another year of shrinkage makes that look about right. It takes the not-exciting title of being the “largest category that’s smaller than it was before the pandemic.”
Hunting, shooting, and trapping grew 5.6% (3.1% after inflation). This is not really my beat, and tbh I’m not exactly sure what’s going on here. It looks like gun sales were down about 13% in 2025, and most of the growth is specifically in the shooting category, which grew 7.3% and is now almost the same size as hunting.
Climbing, hiking, and tent camping grew 5.7% to $8.3 billion, and unlike most of this list, nearly all of that growth holds up after inflation. It’s one of the few bright spots, even if this category (that most people heavily associate with the “outdoor industry”) still only makes up a tiny fraction of the total.
Snow activities are up overall, but that’s almost entirely snowmobiling and other non-resort snow activities (+9.3% after inflation). Skiing and snowboarding both shrank significantly in adjusted dollars.
Paddling keeps falling off a cliff. Kayaking is down another 13% and, after inflation, is about half the size it was in 2019.
There’s clearly still demand for outdoor recreation (the $1.3T number is evidence of that). But stability and growth is happening in the parts of the economy that don’t actually move that massive number quite as much.
The single biggest “conventional activity” in the BEA’s data is multi-use apparel and accessories ($68 billion), which is a catch-all for gear and clothing that can’t be pinned to one activity. It’s about a third of all conventional outdoor recreation, bigger than boating and fishing, and it grew 6.4% after inflation in 2025 after barely moving in 2024. It seems obvious that this would be a big category, given that most outdoor apparel is very multi-use but this is a sizable jump. Without knowing exactly how they reached these numbers, the fun trendy answer would gorpcore. Although it’s been a trend for a while, it does feel like it hit an inflection point in 2025 (I doubt we can truly attribute this jump to that, but it feels relevant).
State outdoor recreation economies
Every state grew in dollars, but once you account for price increases, a handful probably shrank. Unfortunately, there’s no state-level inflation-adjusted data, but it’s not a stretch to say that I’d expect the state data to reflect the trends we’re seeing in activities.
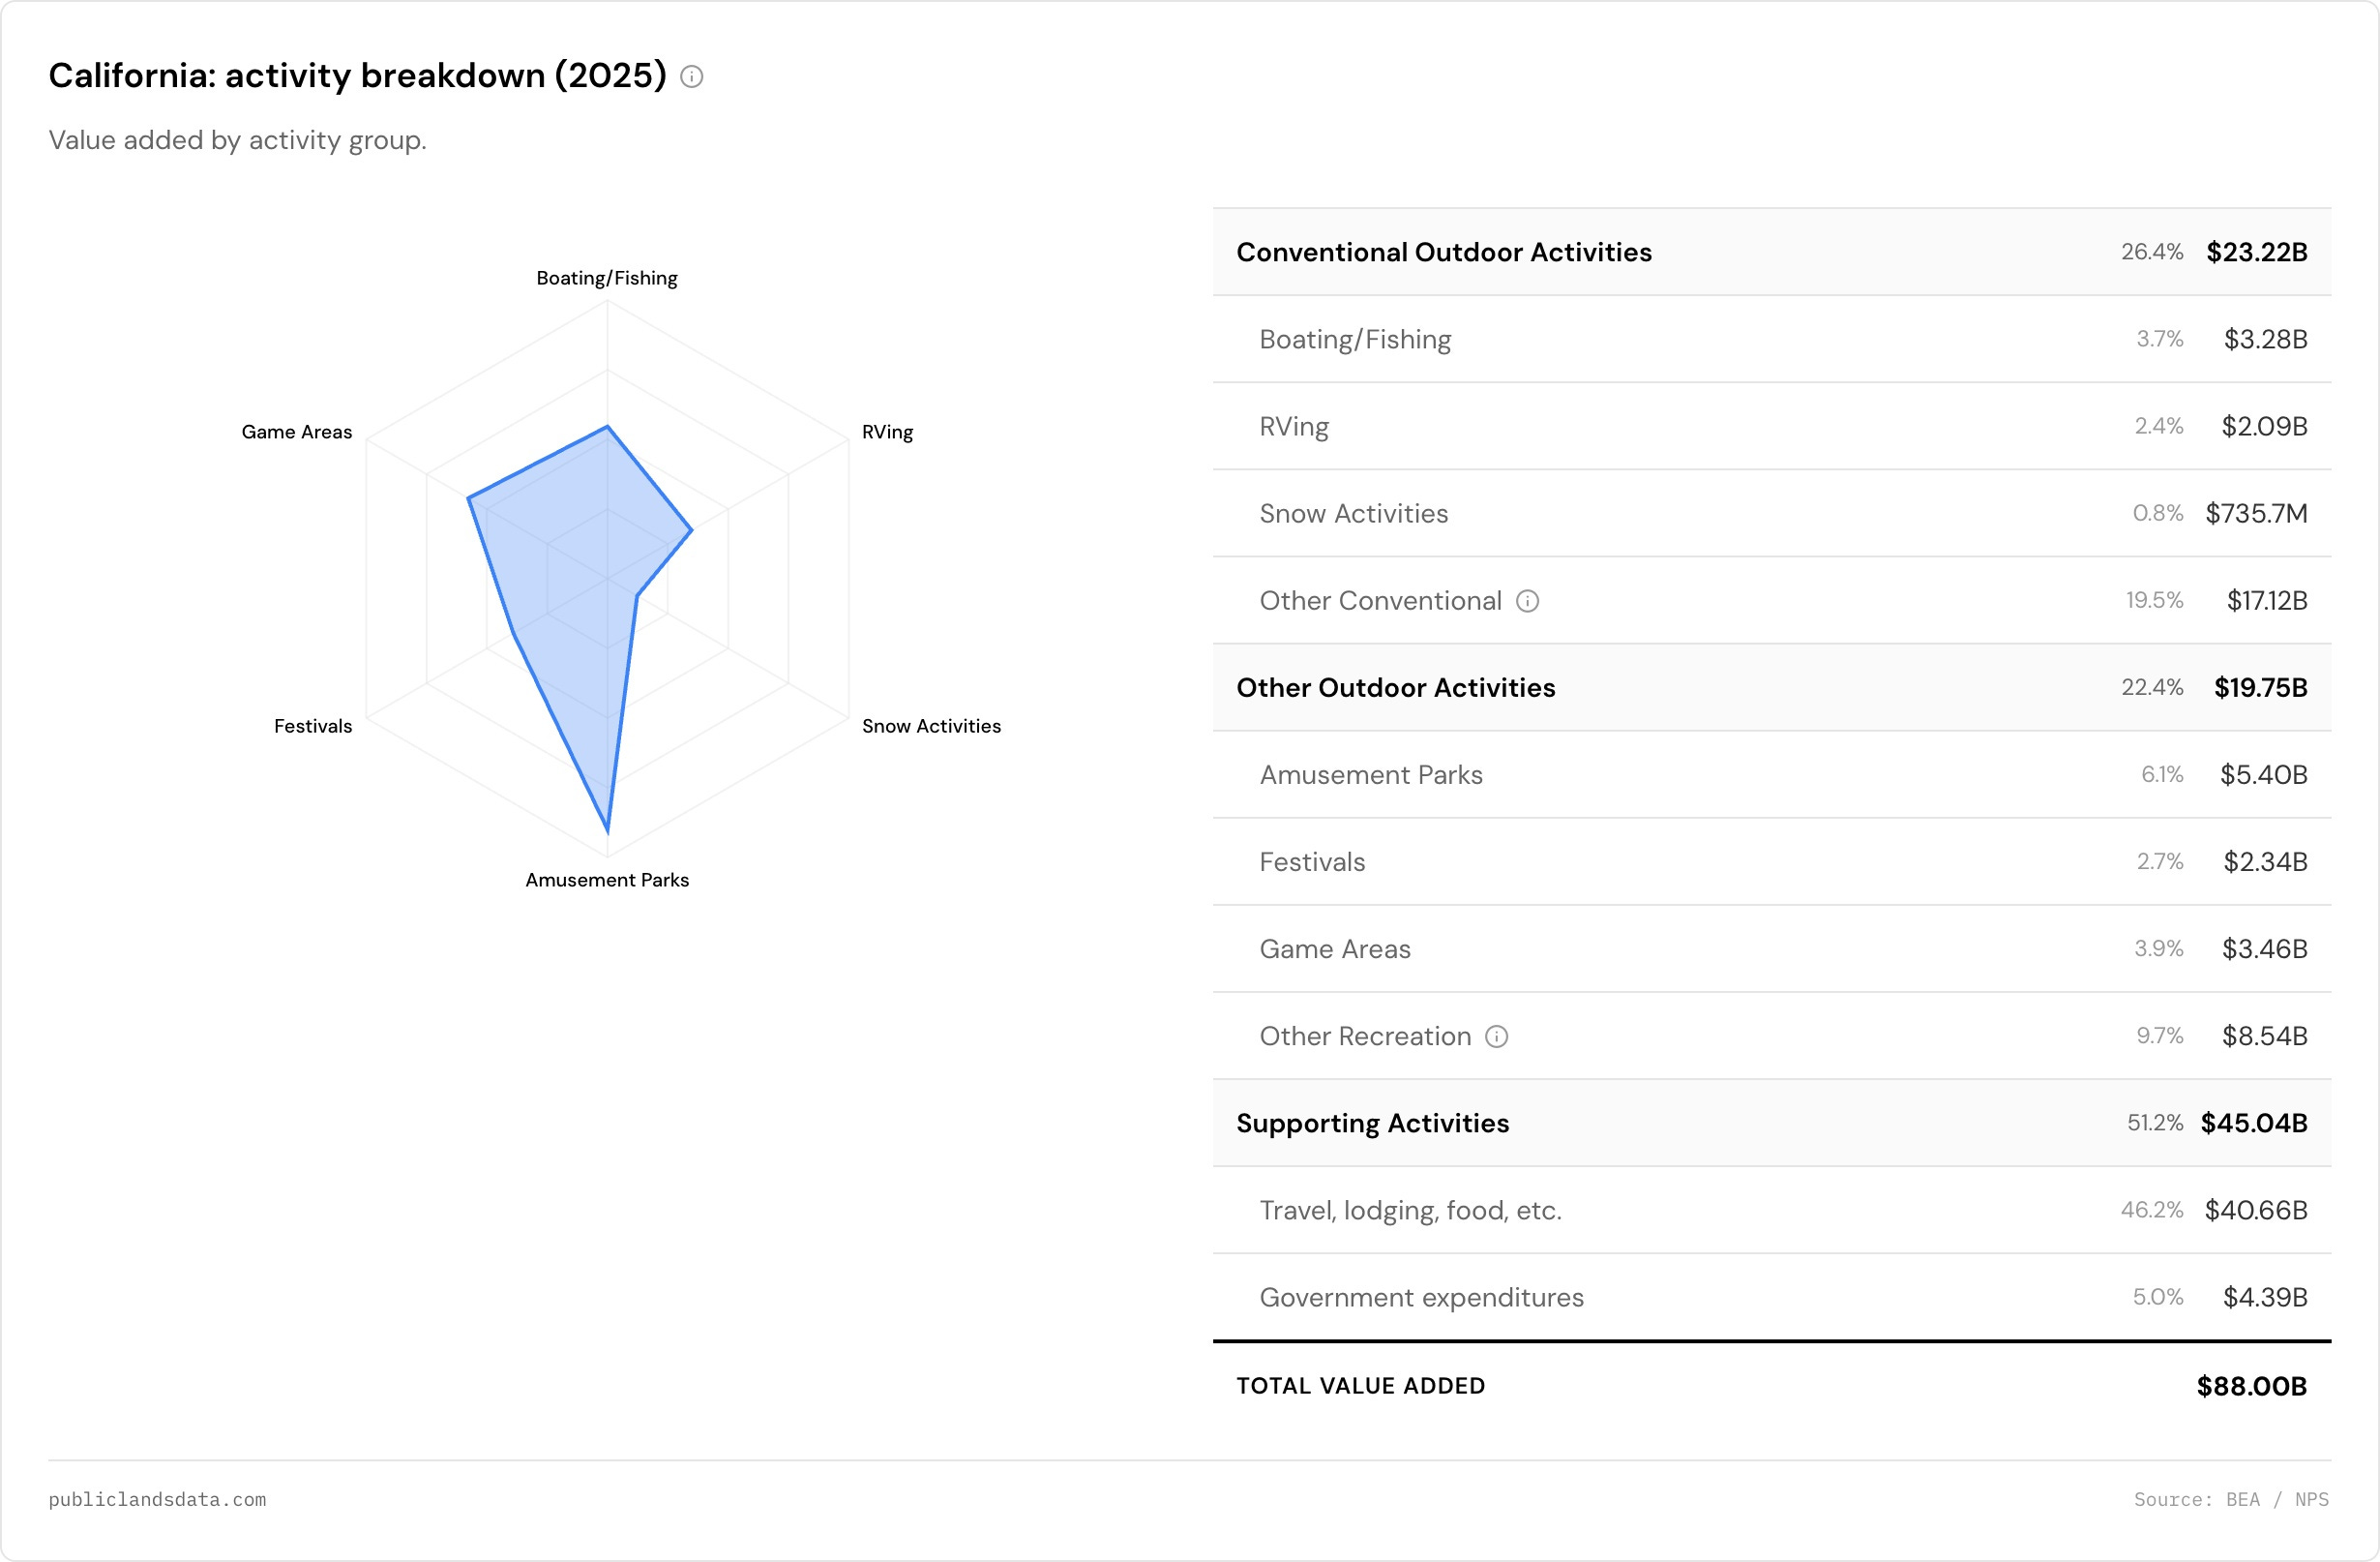
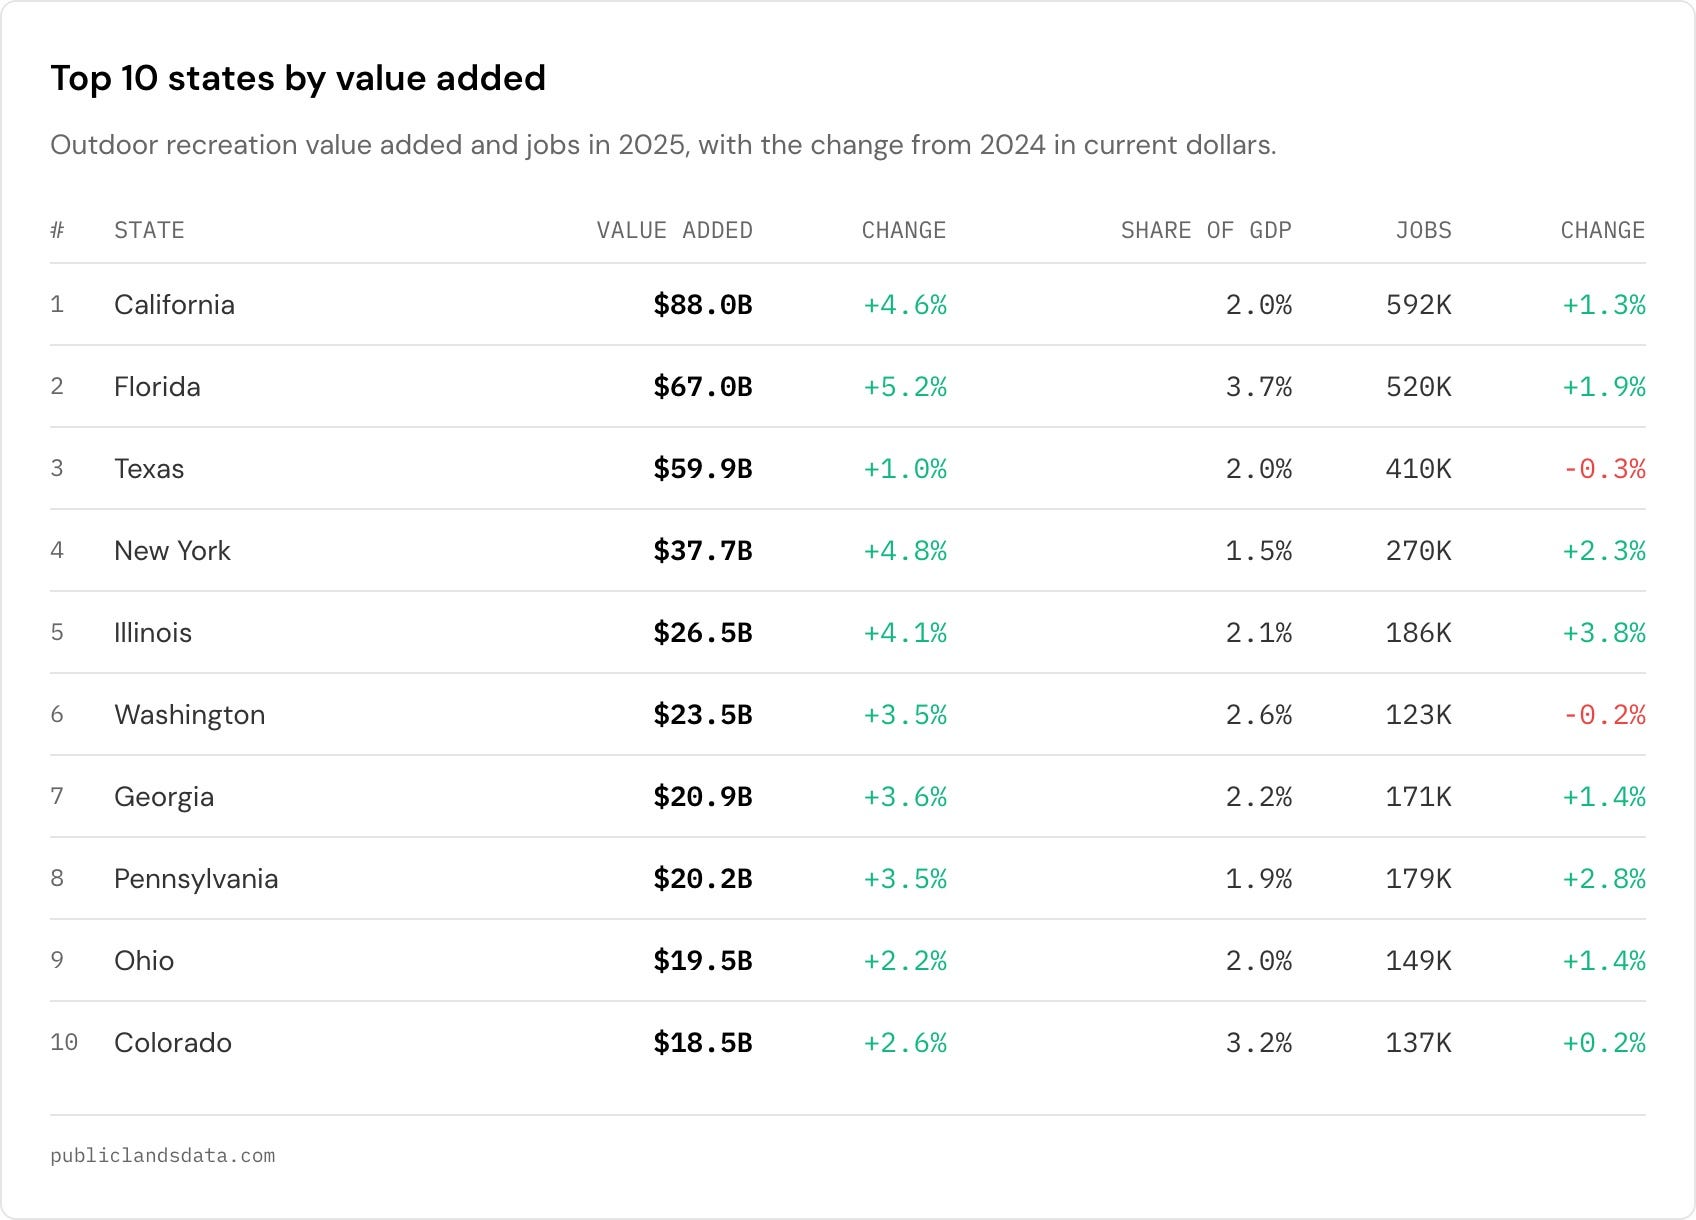
California, Florida, and Texas remain the top outdoor recreation economies in the US. California and Florida together account for more than half of the country’s amusement park activity, though transportation is still the biggest piece of both states’ outdoor economies..
Indiana is where the RV slump hits the hardest. Most of the country’s RVs are built there (in Elkhart), so its outdoor economy is heavily impacted by that industry. In 2025 it grew just 1.6%, less than half the national rate, and once you account for rising prices and the national shrinkage of RVing, it likely shrank as well.
Colorado grew 2.6% but added almost no jobs. Snow activities in Colorado account for $1.75 billion, more than California, Utah, and Washington combined, and the 2025 numbers reflect a pretty good winter season. The abysmal 25/26 winter will have a huge effect on next year’s release.
After losing more than 4% of its outdoor recreation jobs in 2024, Hawaii added 3.6% in 2025; it’s still the most outdoor-recreation-dependent economy in the country.
Alaska went the other way, with value added up 4.3% and jobs down slightly. More money coming in (cruises, most likely), same number of people working.
Some of these numbers are a bit confusing
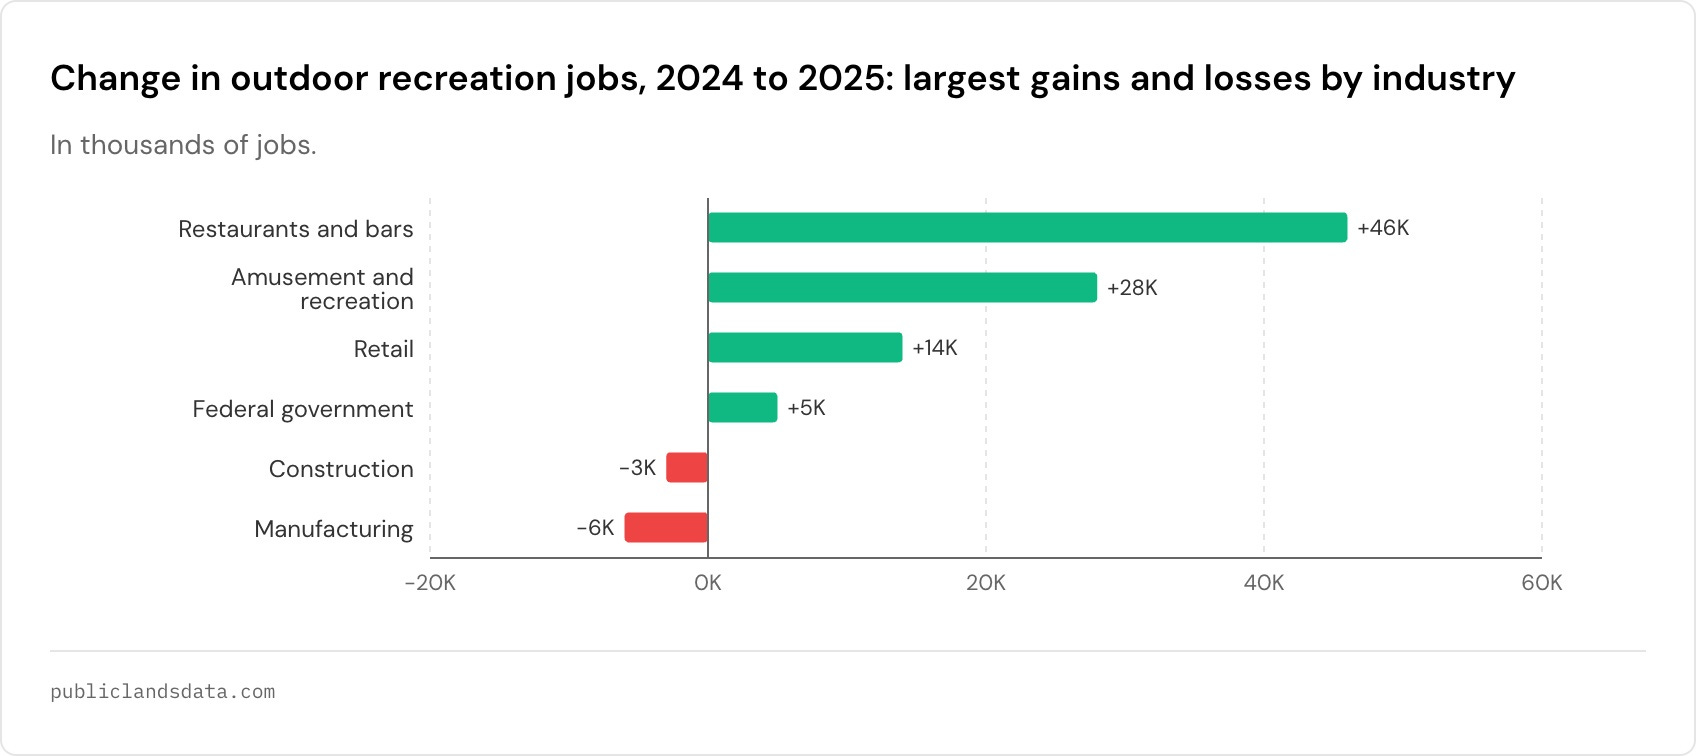
More than half of the 87,000 jobs added in 2025 (about 46,000) were in restaurants and bars. And federal outdoor recreation jobs rose nearly 25%, from about 21,000 to 26,000, in the same year the National Park Service lost about a quarter of its permanent staff, DOGE happened, and federal employment overall fell significantly.
The BEA works in annual numbers, so it’s possible that this is an oddity of distributing annual numbers across the year. For most of 2025, the Park Service and Forest Service were (at least on paper) still paying a lot of people. That still doesn’t explain why it rose 25% in a year when federal employment overall fell by roughly 270,000.
The BEA works out a lot of this data via formulas, not “counting” actual workers. So when its estimate of food spending on outdoor trips jumped 8.3% after inflation, the number of restaurant jobs tied to the outdoor industry goes up, even if the actual number of employees doesn’t change.
Travel vs. activities
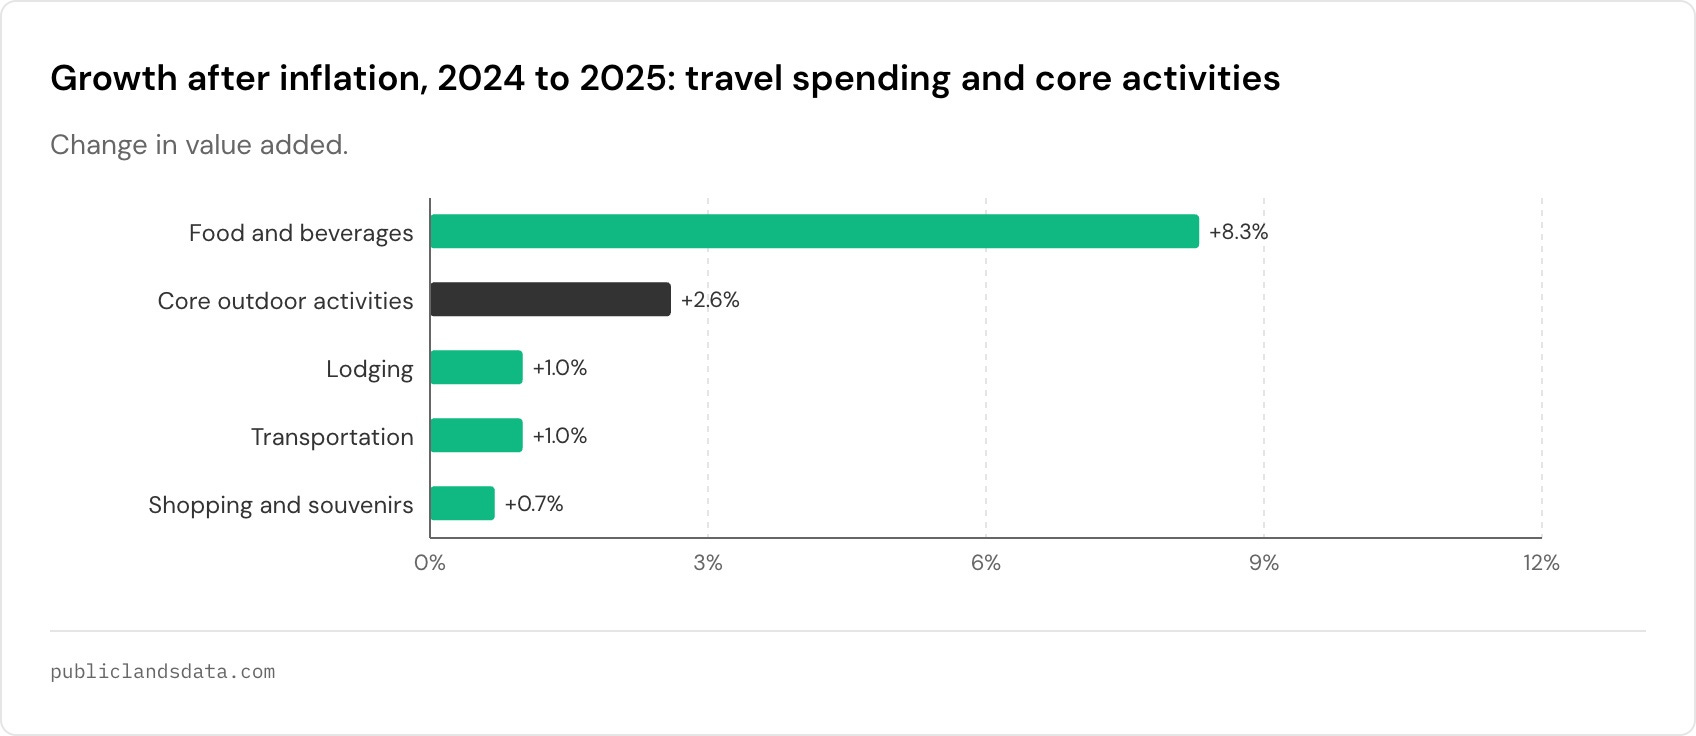
More than half of the outdoor recreation economy is the stuff around activities: getting there, sleeping, eating, and shopping. The BEA’s “trips and travel” category encompasses $256 billion, bigger than every conventional activity combined ($205 billion).
Since 2019, that travel spending has grown almost twice as fast as the activities themselves after inflation (19% vs. 10%). But in 2025, conventional activities grew slightly faster than travel after inflation, and almost all of travel’s growth was in food and drink. Lodging, transportation, and shopping each grew about 1%.
I still think the outdoor recreation economy is mostly a travel economy, but for the 2025 report, people seem to be eating out more and not much else.
The actual size of the “core” outdoor recreation industry
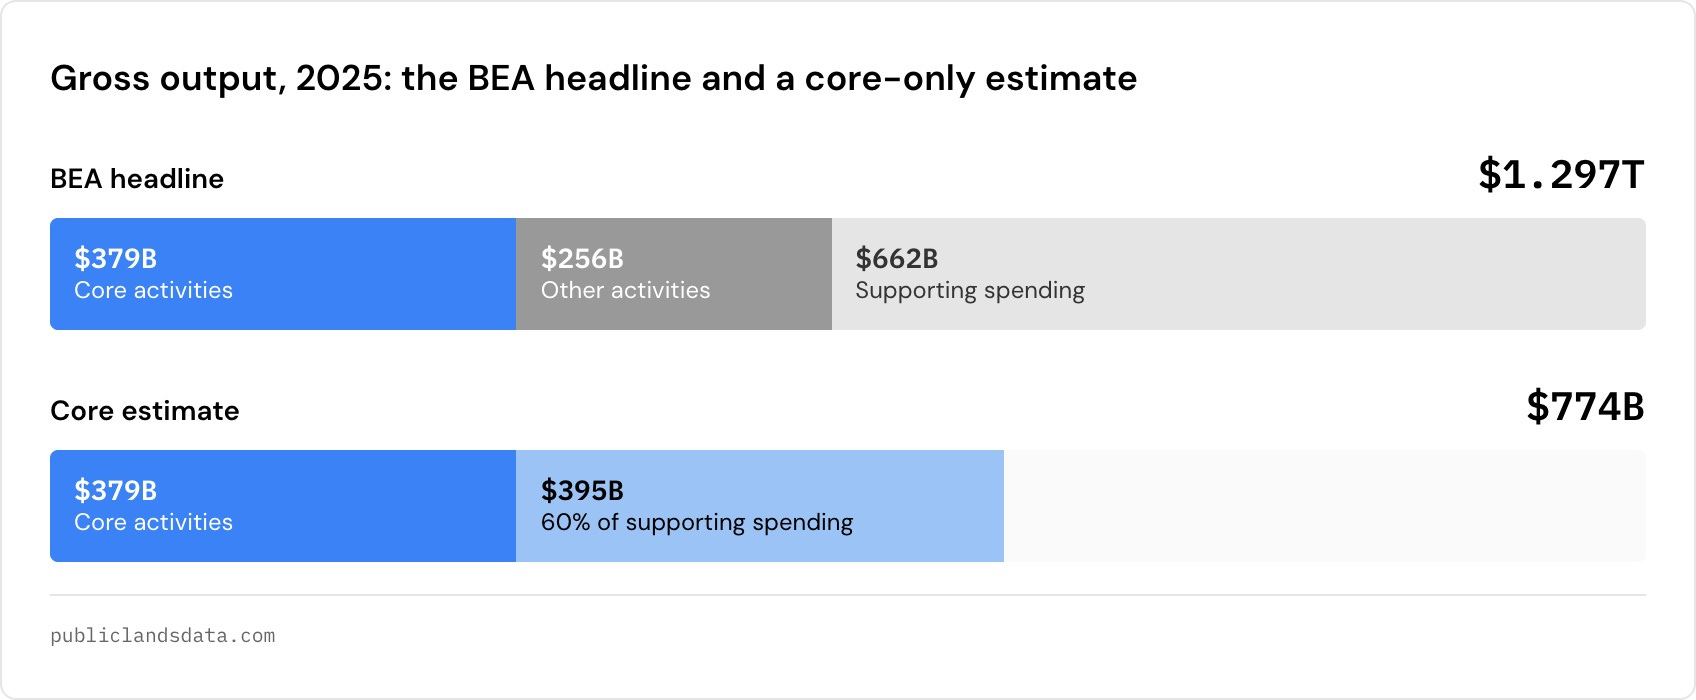
The $1.3 trillion headline includes a lot of things that most people wouldn’t normally call outdoor recreation. So, here’s the same back-of-napkin math I did in March, that pares down the report to something more focused on “core” recreation activities and supporting industries, for 2025.
Headline: $1.297T
“Core” activities (boating, fishing, hiking, RVing, hunting, skiing, and so on): $379B
Other activities (golf, theme parks, festivals, gardening, guided tours): $256B
Supporting spending (travel, lodging, food, local trips, construction, government): $662B
Core’s share of the activities is: 379/(379 + 256), about 60%.
60% of $662B (supporting spending) is about $395B.
$379B + $395B = $774B.
So what?
For the last few years, the pitch to Capitol Hill, tourism boards and funders has been some version of “outdoor recreation is big, and it’s growing faster than everything else.” We’ve kinda lost the second part of that narrative at this point, and it’s trending the wrong direction.
There are bright spots. There’s no question that the outdoor recreation economy is still big. Hiking and camping, fishing, shooting, and gardening all grew after inflation. But the biggest categories by $$ (RVs, boating, travel, theme parks) have mostly grown on price since 2019.
I’m curious which numbers the industry will focus on over the next 12 months. My guess is jobs, since this report shows 1.7% vs 0.4% nationally. But remember, a huge portion of that “growth” is probably existing restaurant jobs “reallocated” toward outdoor recreation. We’ll probably also see a focus on longer timelines, emphasizing how much the industry has grown over the last decade-plus instead of the last ~5 years. Same data, slightly different story.
These stats will show up in industry press, fundraising decks and meetings with lawmakers, as proof the industry drives enough GDP to take seriously. But “invest here, we’re growing” is a tougher message when the outdoor economy is only up 12% in six years after inflation. It’s not going to be nearly as exciting to go back to the same meetings this year and say $1.3T again.
If there’s a compelling case here, it’s that billions of dollars of impact still depend on access to public lands, and those lands need protection and investment if we want these activities to continue growing and supporting local economies around the country.
The full data, including every state, and activity + industry breakdowns, is available at publiclandsdata.com/outdoor-recreation-economy.
Paddling. Any numbers on SUP?